Featured image placement
Upload the chart image in WordPress and place it here at the top of the post.
March 2026 Real Estate Market Update
McFerrin Park, Cleveland Park & Highland Heights
Data: Realtracs MLS · Report Date: April 7, 2026 · By Nick Irwin, Onward Real Estate
The Context You Need First
Before diving into the March numbers, there’s a critical piece of context: February’s ice storm hit Nashville hard. The city shut down for over a week — no power, no showings, no contracts being written. That kind of disruption doesn’t stay contained to a single month. It has a long tail, and we’re seeing that tail in the March data.
With only 4 closed sales across McFerrin Park, Cleveland Park, and Highland Heights in March, virtually every price metric in this report carries an asterisk. Small sample sizes make month-to-month swings look dramatic when they may simply reflect which specific homes happened to close — not a true shift in market conditions. Keep that in mind as you read through the numbers.
Four closings isn’t a demand signal. It’s a weather delay working its way through the pipeline.
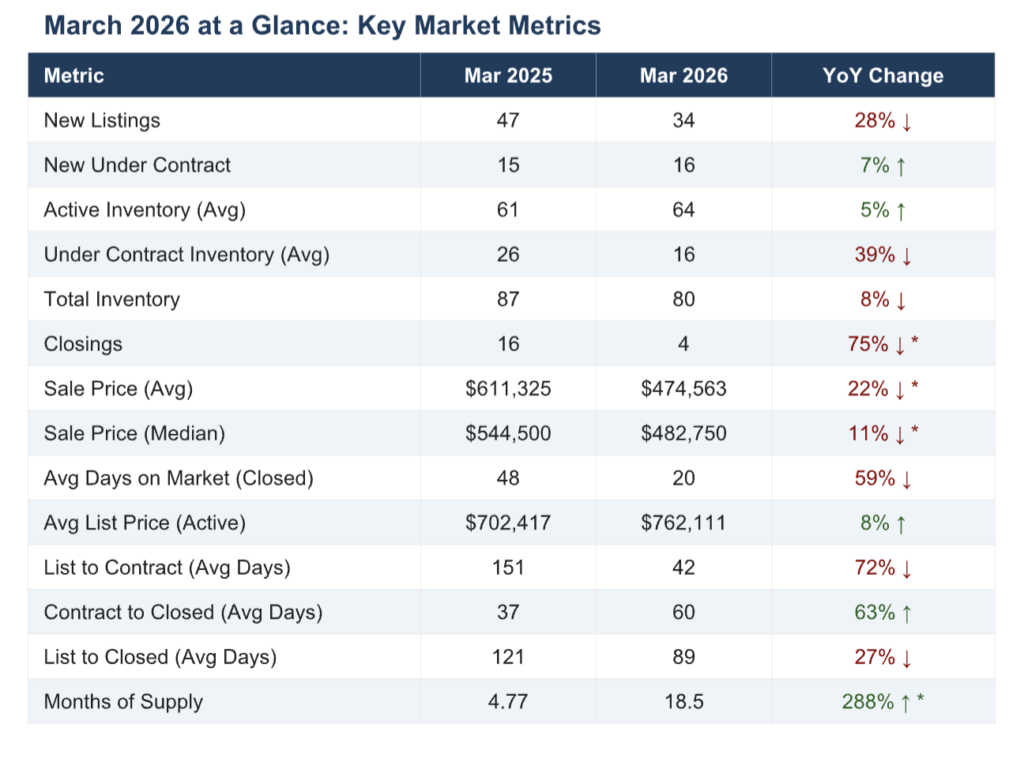
March 2026 at a Glance: Key Market Metrics
| Metric | Mar 2025 | Mar 2026 | YoY Change |
|---|---|---|---|
| New Listings | 47 | 34 | 28% ↓ |
| New Under Contract | 15 | 16 | 7% ↑ |
| Active Inventory (Avg) | 61 | 64 | 5% ↑ |
| Under Contract Inventory (Avg) | 26 | 16 | 39% ↓ |
| Total Inventory | 87 | 80 | 8% ↓ |
| Closings | 16 | 4 | 75% ↓ * |
| Sale Price (Avg) | $611,325 | $474,563 | 22% ↓ * |
| Sale Price (Median) | $544,500 | $482,750 | 11% ↓ * |
| Avg Days on Market (Closed) | 48 | 20 | 59% ↓ |
| Avg List Price (Active) | $702,417 | $762,111 | 8% ↑ |
| List to Contract (Avg Days) | 151 | 42 | 72% ↓ |
| Contract to Closed (Avg Days) | 37 | 60 | 63% ↑ |
| List to Closed (Avg Days) | 121 | 89 | 27% ↓ |
| Months of Supply | 4.77 | 18.5 | 288% ↑ * |
* Metrics marked with an asterisk should be interpreted with caution due to low transaction volume (4 closings). Month-over-month fluctuations in these figures are likely influenced by sample size rather than underlying market trends.
Price Dynamics: Reading Between the Lines
The average sale price in March came in at $474,563 — down 22% from March 2025’s $611,325. The median sale price landed at $482,750, down 11% year-over-year. At face value, those numbers look concerning. In context, they’re much less alarming.
With only 4 closed transactions, the mix of homes that happened to close this month has an outsized effect on both figures. One or two lower-priced properties can pull the average down significantly while the median holds relatively firm — which is exactly the pattern we see here. The median ($482,750) is actually slightly above the average ($474,563), which is a mild inversion from typical market behavior and suggests the closed pool skewed toward more modestly priced homes this month.
For a more reliable read on pricing direction, look at active list prices: sellers currently have homes on the market at an average of $762,111 — up 8% from March 2025. That’s where seller confidence sits. The gap between active list prices and closed prices is wide right now, which brings us to the most important signal for sellers this spring.
Sellers are asking more. Buyers are paying less. The spread between those two numbers is the conversation every seller needs to have before they list.
Supply & Inventory: More Choices for Buyers
Active inventory held relatively steady with 64 homes available on average, up just 5% from 61 in March 2025. Total inventory came in at 80 homes, down 8% year-over-year — not a dramatic shift in either direction.
Months of supply, however, tells a more pointed story. With only 4 closings in the month, the calculation produces an elevated figure that reflects the storm-driven pipeline delay as much as actual supply conditions. Directionally, though, the market has shifted: buyers have more breathing room than they did a year ago, and the urgency that characterized 2023 and early 2024 has largely dissipated in this neighborhood cluster.
New listings were down 28% year-over-year (34 vs. 47), which is worth watching. Fewer new listings coming to market could tighten supply heading into summer — particularly if the ice storm backlog clears and closings normalize in April and May.
Buyer Behavior: The Real Signal in the Data
Here’s what’s easy to miss when you’re focused on the headline price numbers: buyer activity in March was genuinely healthy. Sixteen homes went under contract — up 7% from 15 in March 2025. That’s a quiet but meaningful indicator that motivated buyers are still engaging with the market.
Even more telling is the average days on market for closed homes: just 20 days, down 59% from 48 days in March 2025. The homes that found buyers this month moved quickly. That’s not the profile of a market in distress — it’s the profile of a market that rewards correctly priced inventory.
List-to-contract time also dropped dramatically, from 151 days to 42 days. That’s a 72% improvement and suggests that sellers who are pricing realistically relative to current conditions aren’t waiting long for offers.
The homes that moved in March moved fast. Twenty days on market is not a struggling market — it’s a selective one.
What This Means If You’re Thinking About Selling
The March data surfaces a critical tension for sellers: active list prices are rising, but closed prices are not keeping pace. If you’re planning to list this spring, that gap is the most important number in this report.
Homes that are priced in line with where buyers are actually transacting — not where sellers hope to transact — are still moving efficiently. The risk for sellers right now is anchoring to the higher end of the active list price range and sitting on the market while better-priced competition attracts the buyers.
The ice storm created a compressed pipeline. As that backlog clears through April and May, expect more competition among both buyers and sellers. Listing sooner, priced correctly, positions you ahead of that wave rather than in the middle of it.
Key Takeaways for Sellers
- Price to where buyers are paying, not where active listings are listed — that gap is real and significant right now
- Homes priced correctly are still going under contract in about 42 days from list
- Expect more competition as the spring market heats up and the storm backlog clears
- The 8% rise in active list prices signals seller confidence, but it hasn’t translated to closed prices yet
What This Means If You’re Thinking About Buying
March was genuinely a buyer’s market in these neighborhoods — more inventory, less competition, and sellers who have been sitting on the market for a while are increasingly open to negotiation. The months of supply figure, even accounting for the storm distortion, reflects a market that has tilted meaningfully in buyers’ favor compared to 12 months ago.
That said, right-priced homes are still moving quickly. If you find a home that’s well-positioned in the market, don’t assume you have unlimited time to decide. The 20-day average DOM for closed homes tells you that correctly priced inventory doesn’t linger.
April and May will bring more clarity. As the storm backlog clears and more homes close, pricing trends will become more statistically reliable. If you’re in the early stages of your search, now is a good time to get pre-approved and get familiar with inventory so you’re positioned to move when the right home comes along.
Key Takeaways for Buyers
- More inventory and less urgency than a year ago — this is the most buyer-friendly market we’ve seen in these neighborhoods in several years
- Right-priced homes still move fast (20-day average DOM) — don’t sleep on a well-priced listing
- Sellers with elevated list prices may be negotiable, especially those with longer days on market
- Get pre-approved now; April and May closings will bring more comparable data and pricing clarity
The Bottom Line
March 2026 looks unusual on paper because it is unusual — but for explainable reasons. The February ice storm created a pipeline delay that compressed closings and distorted price metrics. The underlying signals — 16 new contracts, 20-day average DOM, faster list-to-contract times — point to a market that’s functioning, not stalling.
What the data does confirm is a market in transition: more inventory than a year ago, buyers with more negotiating leverage, and a meaningful gap between seller aspirations and buyer reality on pricing. How that gap closes over the next 60–90 days will be the real story of spring 2026 in these neighborhoods.
As always, I’ll be watching it closely — and I’ll have the April numbers in your hands as soon as they’re available.
Have questions about your specific situation? I’m a neighbor first and an agent second — reach out anytime.
Nick Irwin · Onward Real Estate
Hyper-Local Specialist: McFerrin Park, Cleveland Park & Highland Heights