April 2026 Market Update
McFerrin Park · Cleveland Park · Highland Heights
Single-Family Residential | Source: Realtracs | Data Period: April 2026
What the Numbers Are Saying
April 2026 was one of the more active months these neighborhoods have seen in a while, but you have to read past the headline number to understand what’s actually happening. The average sale price jumped 14% year over year to $720,954 — but the median held almost perfectly flat at $619,900. That gap tells a specific story: a small group of high-end closings is pulling the average up, not a broad-based surge in home values across the board.
The more telling signal is in contract activity. New homes going under contract rose 54% compared to April 2025. That’s not noise. Buyer demand in McFerrin Park, Cleveland Park, and Highland Heights is real and measurable right now.
New contracts jumped 54% year over year — the clearest sign yet that buyer demand in these neighborhoods is accelerating.
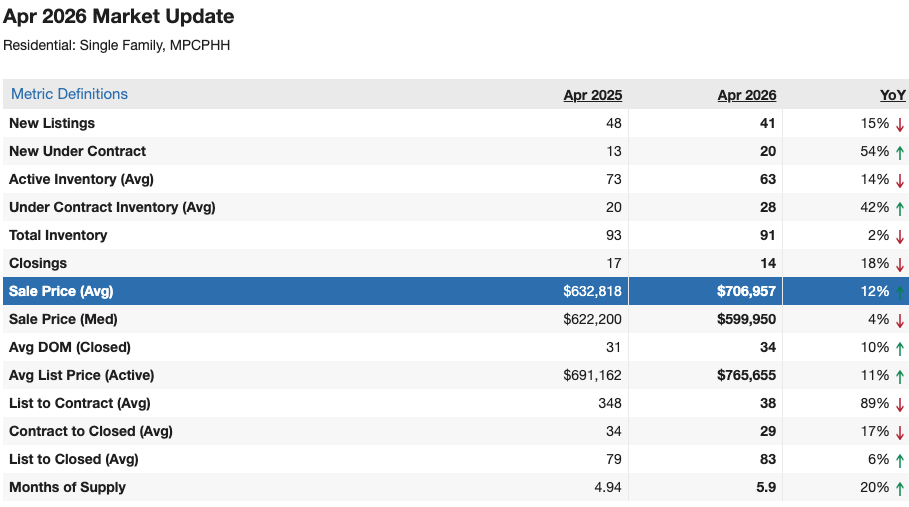
April 2026 vs. April 2025 at a Glance
|
Metric |
Apr 2025 |
Apr 2026 |
YoY Change |
|
New Listings |
48 |
30 |
38% ↓ |
|
New Under Contract |
13 |
20 |
54% ↑ |
|
Active Inventory (Avg) |
73 |
63 |
14% ↓ |
|
Under Contract Inventory (Avg) |
20 |
28 |
42% ↑ |
|
Total Inventory |
93 |
91 |
2% ↓ |
|
Closings |
17 |
13 |
24% ↓ |
|
Sale Price (Avg) |
$632,818 |
$720,954 |
14% ↑ |
|
Sale Price (Median) |
$622,200 |
$619,900 |
0% ↓ |
|
Avg DOM (Closed) |
31 days |
29 days |
8% ↓ |
|
Avg List Price (Active) |
$691,162 |
$765,655 |
11% ↑ |
|
List to Contract (Avg) |
348 days |
38 days |
89% ↓ |
|
Contract to Closed (Avg) |
34 days |
29 days |
16% ↓ |
|
List to Closed (Avg) |
79 days |
79 days |
1% ↑ |
|
Months of Supply |
4.94 |
6.36 |
29% ↑ |
Source: Realtracs. Single-family residential, MPCPHH. Report Date: 05/04/2026.
Average vs. Median: What the Gap Means for You
When average and median sale prices diverge this significantly, it’s usually worth a closer look. In April, only 13 homes closed in MPCPHH — a relatively small sample. A handful of sales at the higher end of the price range have enough weight to pull the average upward without moving the median at all.
The median is the more stable benchmark in low-volume months. At $619,900, it’s essentially flat year over year, which points to a market that’s holding value at the middle rather than broadly appreciating. If you’re a seller, this means pricing strategy matters more than it did in a hotter market. Overpricing in a 6.36-month supply environment tends to produce longer days on market, not a bidding war.
Contract Activity: The Real Story
While closings were down slightly (13 vs. 17 last April), the contract pipeline tells a different story entirely. Here’s what stands out:
- New Under Contract: up 54% year over year (13 to 20)
- Under Contract Inventory: up 42% (20 to 28 on average)
- List-to-Contract time dropped from 348 days to 38 days
That List-to-Contract figure deserves context. The 348-day average from April 2025 was almost certainly skewed by outlier properties that sat on the market for an extended period before going under contract. This April’s 38-day average is a far more representative figure, and it signals that homes priced correctly are moving in just over a month.
Homes priced right are going under contract in about 38 days. The ones that aren’t priced right are sitting.
Inventory and Months of Supply
Total inventory came in at 91 homes, nearly identical to last April’s 93. Active inventory (those not yet under contract) is actually down 14% year over year, which is a mild positive for sellers. But months of supply climbed to 6.36, up 29% from 4.94 last April.
The conventional threshold for a balanced market is around 6 months of supply. At 6.36, MPCPHH is technically sitting at the edge of a buyer’s market — not deeply into it, but enough that sellers shouldn’t assume the market will absorb overpricing the way it might have in 2021 or 2022.
New listings dropped 38% year over year (48 to 30), which is actually helping keep supply from ballooning further. Fewer homes entering the market means competition among available inventory stays manageable.
What This Means for Buyers
- Buyer activity is genuinely strong right now. You have more options than you did a year ago, and you’re not competing in a frenzied bidding environment.
- Well-priced homes in McFerrin Park, Cleveland Park, and Highland Heights are still moving in about 38 days. If something is sitting longer, it’s worth investigating why — often it’s a pricing issue, not a property issue.
- Active list prices are running around $765,655 on average. With a median closing price of $619,900, there is room for negotiation in certain segments, particularly at higher price points.
What This Means for Sellers
- The demand is there. A 54% jump in new contracts is not a fluke — buyers are actively pursuing homes in these neighborhoods.
- Pricing precision is critical in a 6.36-month supply environment. The spread between average list price ($765,655) and median closing price ($619,900) is wide, and homes that are overpriced relative to recent comps are not benefiting from that buyer activity.
- A well-priced, turnkey home is your strongest position. Repair negotiations are consistently the biggest deal-killer in this market, and buyers have enough options right now that they will walk rather than take on deferred maintenance.
Frequently Asked Questions
What are homes selling for in McFerrin Park, Cleveland Park, and Highland Heights?
The median sale price for single-family homes in MPCPHH was $619,900 in April 2026, essentially flat compared to April 2025. The average sale price was $720,954, up 14% year over year, but this figure is influenced by a small number of higher-end closings in a low-volume month.
Is it a buyer’s or seller’s market in East Nashville right now?
With 6.36 months of supply, MPCPHH is sitting right at the threshold between balanced and a buyer’s market. Buyers have options and negotiating leverage, particularly at higher price points. Sellers who price accurately are still seeing strong contract activity — new contracts rose 54% year over year in April 2026.
How long does it take to sell a home in these neighborhoods?
Homes that closed in April 2026 averaged 29 days on market, down slightly from 31 days in April 2025. The average time from listing to going under contract was 38 days. The full cycle from list to close averaged 79 days, consistent with the prior year.
Ready to talk about what this means for your home?
Nick Irwin is a neighborhood specialist with BaseNashville and Compass, focused exclusively on McFerrin Park, Cleveland Park, and Highland Heights. Reach out to get a straight answer on where your home stands in today’s market.
Nick Irwin, REALTOR® | BaseNashville | Compass