What are homes selling for in McFerrin Park, Cleveland Park, and Highland Heights in August 2026?
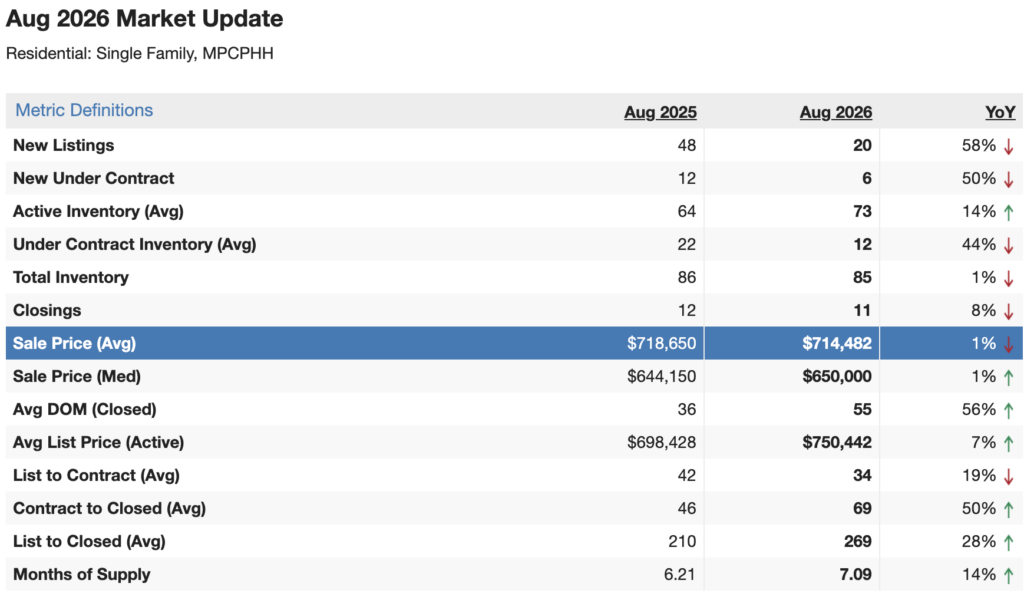
The median sale price across MPCPHH was $637,450 in August 2026, up 1% from $644,150 in August 2025. Eleven homes closed. Months of supply rose to 7.09.
August was slower than it’s been all year, and I think it’s worth being straightforward about that rather than spinning it. New listings dropped 58% compared to August 2025, from 48 down to 20. New contracts signed fell 50%, from 12 to 6. Months of supply hit 7.09, the highest number these neighborhoods have posted in 2026. If you’ve been watching this market through my monthly updates, you know that number has been climbing since May.
None of that is a crisis. But it does mean the conversation about whether now is a good time to sell has gotten more nuanced, and I’d rather give you the honest read than tell you everything is fine.
Here’s what actually happened in August, address by address.
Twelve closings across McFerrin Park, Cleveland Park, and Highland Heights. The fastest sale of the month was 3014 Edwin Circle, listed at $624,900 and closed in one day at full price. 504 Edwin Street sold before it was technically active — zero days on market, $7,100 over asking. 1601 Jones Avenue, a 1919-built four-bedroom on 2,784 square feet, listed at $925,000 and closed in five days at $915,000. 1344 Stainback listed at $699,900 and closed in ten days at $695,000. Those four sales happened fast and close to asking, and they have something in common: they were all priced where the market actually was.
The other half of the month told a different story. 1347 Pennock Avenue listed at $1,150,000, sat for 39 days, and closed at $1,050,000 — $100,000 under asking. 1320 B Lischey listed at $1,075,000, sat for 109 days, and closed at $1,000,000 — $75,000 under asking. 925 Chickasaw listed at $550,000 and closed at $512,500 after 12 days, a $37,500 gap. 801 Cherokee Ave is the most extreme example — listed at $399,000, it sat for 270 days before closing at $387,500. That home spent most of the year on the market.
Six of the twelve closings came in under asking price. Two sold over. Four sold at list. The average days on market across all twelve was 51.8 days, pulled up significantly by the homes that sat. When you strip out the two that were over 60 days, the rest averaged closer to 17.
Here’s how August compared to last year. New listings: 48 to 20, down 58%. New under contract: 12 to 6, down 50%. Active inventory: 64 to 73, up 14%. Under contract inventory: 22 to 12, down 44%. Total inventory: 86 to 85, essentially flat. Closings: 12 to 11, down 8%. Average sale price: $718,650 to $714,482, down 1%. Median: $644,150 to $650,000, up 1%. Average days on market for closed sales: 36 to 55, up 56%. Average list price on active homes: $698,428 to $750,442, up 7%. Months of supply: 6.21 to 7.09, up 14%.
Source: Realtracs. Single-family residential, MPCPHH. Report Date: 09/03/2026.
The active inventory right now is 81 homes. The average list price is $769,501. The median list price is $639,900. That gap between average and median tells you there are some high-end listings pulling the average up significantly — and several of those are the homes that have been sitting the longest. Of the 81 active listings, 28 have been on the market for 60 days or more. Twenty have been sitting for 90 days or more. Fourteen have crossed 120 days.
The price band breakdown on active inventory: 20% are listed under $500,000, 42% between $500,000 and $700,000, 21% between $700,000 and $1 million, and 17% over $1 million. That upper 17% — the 14 homes listed over $1 million — is where the market is showing the most resistance. August’s closings reflected that directly. Both of the homes that closed over $1 million came in well under asking, and both had been sitting for weeks or months before a deal came together.
For anyone thinking about selling, the honest answer to whether now is a good time depends almost entirely on where you’re priced and what segment you’re in. Under $650,000 in these neighborhoods, demand is still real and well-priced homes are moving quickly. The $650,000 to $1 million range is workable but buyers are negotiating, and the days of getting asking price without pushback are mostly gone. Over $1 million, August showed clearly that buyers have leverage and they’re using it. Both closings in that range gave up between $75,000 and $100,000 from list price.
For buyers, 7.09 months of supply and 20 homes sitting at 90 days or more means you have real options and real negotiating room, particularly in the upper price ranges. Homes that have been sitting since spring are being held by sellers who have had time to recalibrate their expectations. That’s a different conversation than it was in April.
The median came in at $637,450, up slightly from $644,150 in August 2025. Price per square foot on August’s closings ranged from $222 on the low end to $403 on the high end, with most falling between $290 and $345. The spread reflects the wide range of home ages, sizes, and conditions that traded this month.
Nick Irwin is a neighborhood specialist with BaseNashville and Compass, focused on McFerrin Park, Cleveland Park, and Highland Heights. If you want to know what your specific home is worth in this market right now — not a ballpark, an actual number based on what’s closed on your street — reach out.
Nick Irwin, REALTOR® | BaseNashville | Compass
nick@basenashville.com | 615-418-0563